Drawing spans everything from quick pencil sketches to fully digital illustrations. The latest large-scale surveys don’t always isolate “drawing” as a single activity, but they do capture closely related measures like visual art-making, self-reported drawing skill, stress-relief creativity, and how often people share art online.
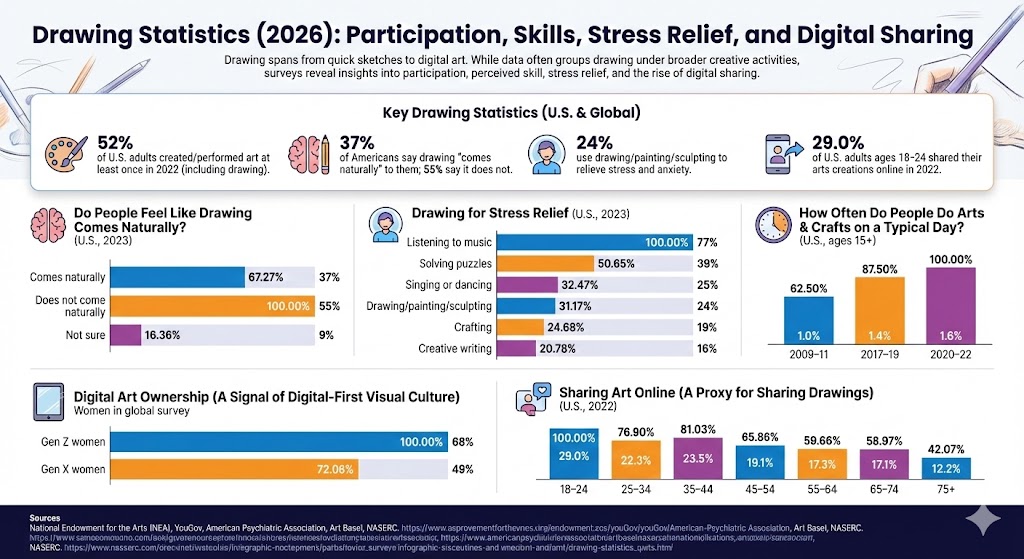
52% of U.S. adults personally created and/or performed art at least once in 2022 (a category that can include visual art-making such as drawing).
37% of Americans say drawing “comes naturally” to them; 55% say it does not.
24% of U.S. adults said drawing/painting/sculpting is a creative activity they use to relieve stress and anxiety.
65% of U.S. adults said they engage in creative activities in their free time, and 46% said they do so to relieve stress and anxiety.
Among comparable survey measures, the share of U.S. adults who created or performed art rose from 31.9% (2017) to 42.8% (2022).
29.0% of U.S. adults ages 18–24 shared their arts creations or performances online in 2022 (vs. 12.2% among ages 75+).
On a typical day (three-year average), 1.6% of Americans ages 15+ did “arts and crafts as a hobby” in 2020–22 (an umbrella that can include activities such as artistic painting).
In a global collecting survey summary, 68% of Gen Z women reported owning a digital artwork (vs. 49% of Gen X women).
Do People Feel Like Drawing Comes Naturally?
This measure reflects perceived natural ability (not frequency). It’s useful for understanding confidence barriers that can affect whether people choose to draw, stick with it, or share their work publicly.
Chart: Drawing “comes naturally” (U.S., 2023)
Label
Bar
Value
Comes naturally
37%
Does not come naturally
55%
Not sure
9%
Max = 55%. Widths: Comes naturally 67.27%, Does not come naturally 100.00%, Not sure 16.36%
Drawing for Stress Relief
In a U.S. poll on creativity and mental health, drawing/painting/sculpting ranked among common stress-relief activities—behind listening to music and puzzles, but ahead of some other creative outlets like writing.
Chart: Creative activities used to relieve stress/anxiety (U.S., 2023)
Label
Bar
Value
Listening to music
77%
Solving puzzles
39%
Singing or dancing
25%
Drawing/painting/sculpting
24%
Crafting
19%
Creative writing
16%
Max = 77%. Widths: Listening to music 100.00%, Solving puzzles 50.65%, Singing or dancing 32.47%, Drawing/painting/sculpting 31.17%, Crafting 24.68%, Creative writing 20.78%
How Often Do People Do Arts & Crafts on a Typical Day?
Time-use data tracks what people did on a given day (not whether they did it at any point during a year). The “arts and crafts as a hobby” category can include a wide range of hands-on creative activities and has been measured as a small but measurable share on an average day.
Chart: Arts & crafts as a hobby on a typical day (U.S., ages 15+)
Label
Bar
Value
2009–11
1.0%
2017–19
1.4%
2020–22
1.6%
Max = 1.6%. Widths: 2009–11 62.50%, 2017–19 87.50%, 2020–22 100.00%
Sharing Art Online (A Proxy for Sharing Drawings)
Posting sketches, illustrations, and progress videos is now a common way to participate in drawing culture. Survey data show large age differences in who shares their creations online.
Chart: Shared arts creations/performances online (U.S., 2022)
Digital Art Ownership (A Signal of Digital-First Visual Culture)
Digital tools have expanded drawing participation beyond paper. In a global collecting survey summary, digital artwork ownership was reported as higher among Gen Z women than Gen X women.
Chart: Owned a digital artwork (women, global collecting survey summary)
Label
Bar
Value
Gen Z women
68%
Gen X women
49%
Max = 68%. Widths: Gen Z women 100.00%, Gen X women 72.06%
Sources
National Endowment for the Arts (NEA) — Arts Participation Patterns in 2022: Highlights from the Survey of Public Participation in the Arts (PDF): https://www.arts.gov/sites/default/files/2022-SPPA-final.pdf
National Endowment for the Arts (NEA) — By All Means, the Arts: A Full Report of the 2022 Survey of Public Participation in the Arts (SPPA) (PDF): https://www.arts.gov/sites/default/files/SPPA_Comprehensive_Report_FINAL.pdf
National Endowment for the Arts (NEA) / NASERC — Indicator B.4: How Much Time Do Americans Spend on Art Activities? (PDF): https://www.arts.gov/sites/default/files/b4-report-202403.pdf
YouGov — YouGov Survey: Art (poll results PDF): https://d3nkl3psvxxpe9.cloudfront.net/documents/Art_poll_results.pdf
YouGov — “What do Americans say about art styles and their own artistic abilities?” (context article): https://today.yougov.com/entertainment/articles/45623-art-styles-being-artistic-Americans-poll
American Psychiatric Association — “New APA Poll: Americans Who Engage in Creative Activities…”: https://www.psychiatry.org/news-room/news-releases/new-apa-poll-americans-who-engage-in-creative-acti
Art Basel — “Digital art is going mainstream” (Survey of Global Collecting 2025 summary): https://www.artbasel.com/stories/digital-art-boom-gen-z-collectors?lang=en